about.
Before this project, execs at Juniper were making customer-facing decisions with a dashboard that surfaced barely a handful of metrics, offering almost zero visibility and little clarity into what individual customers and their devices were actually doing. As the sole developer of this project, I worked closely alongside the Head of Juniper Threat Labs to integrate key features exposing new data, visualizing metrics, and optimizing client-side performance while analyzing over 20,000 unique devices concurrently.
challenges.
The hardest part wasn't writing code. It was starting with zero context on someone else's system and having to reverse-engineer the architecture, the data, and the entire deployment lifecycle before I could ship a single feature. With vague system collection periods and APIs I didn't write, it was initially challenging to understand what was going on.
Over the course of multiple days, chatting with a mentor, and utilizing generative AI to summarize entire repositories, I gained a working understanding of the architecture in a fraction of the time it would've otherwise taken. In prior internships, grasping unfamiliar architecture like this took me 5 to 10 times longer, making clear how much these tools have changed the ramp-up process for engineers.

development.
I inherited a system I'd never touched: undocumented architecture, unfamiliar databases, and a production pipeline I had to learn from scratch. From there, I rebuilt it into a fully dynamic analytics platform, solo. Constructing a frontend comprised of HTML, CSS, and JS, I utilized Chart.js for visualizations and AWS S3 for static site hosting.
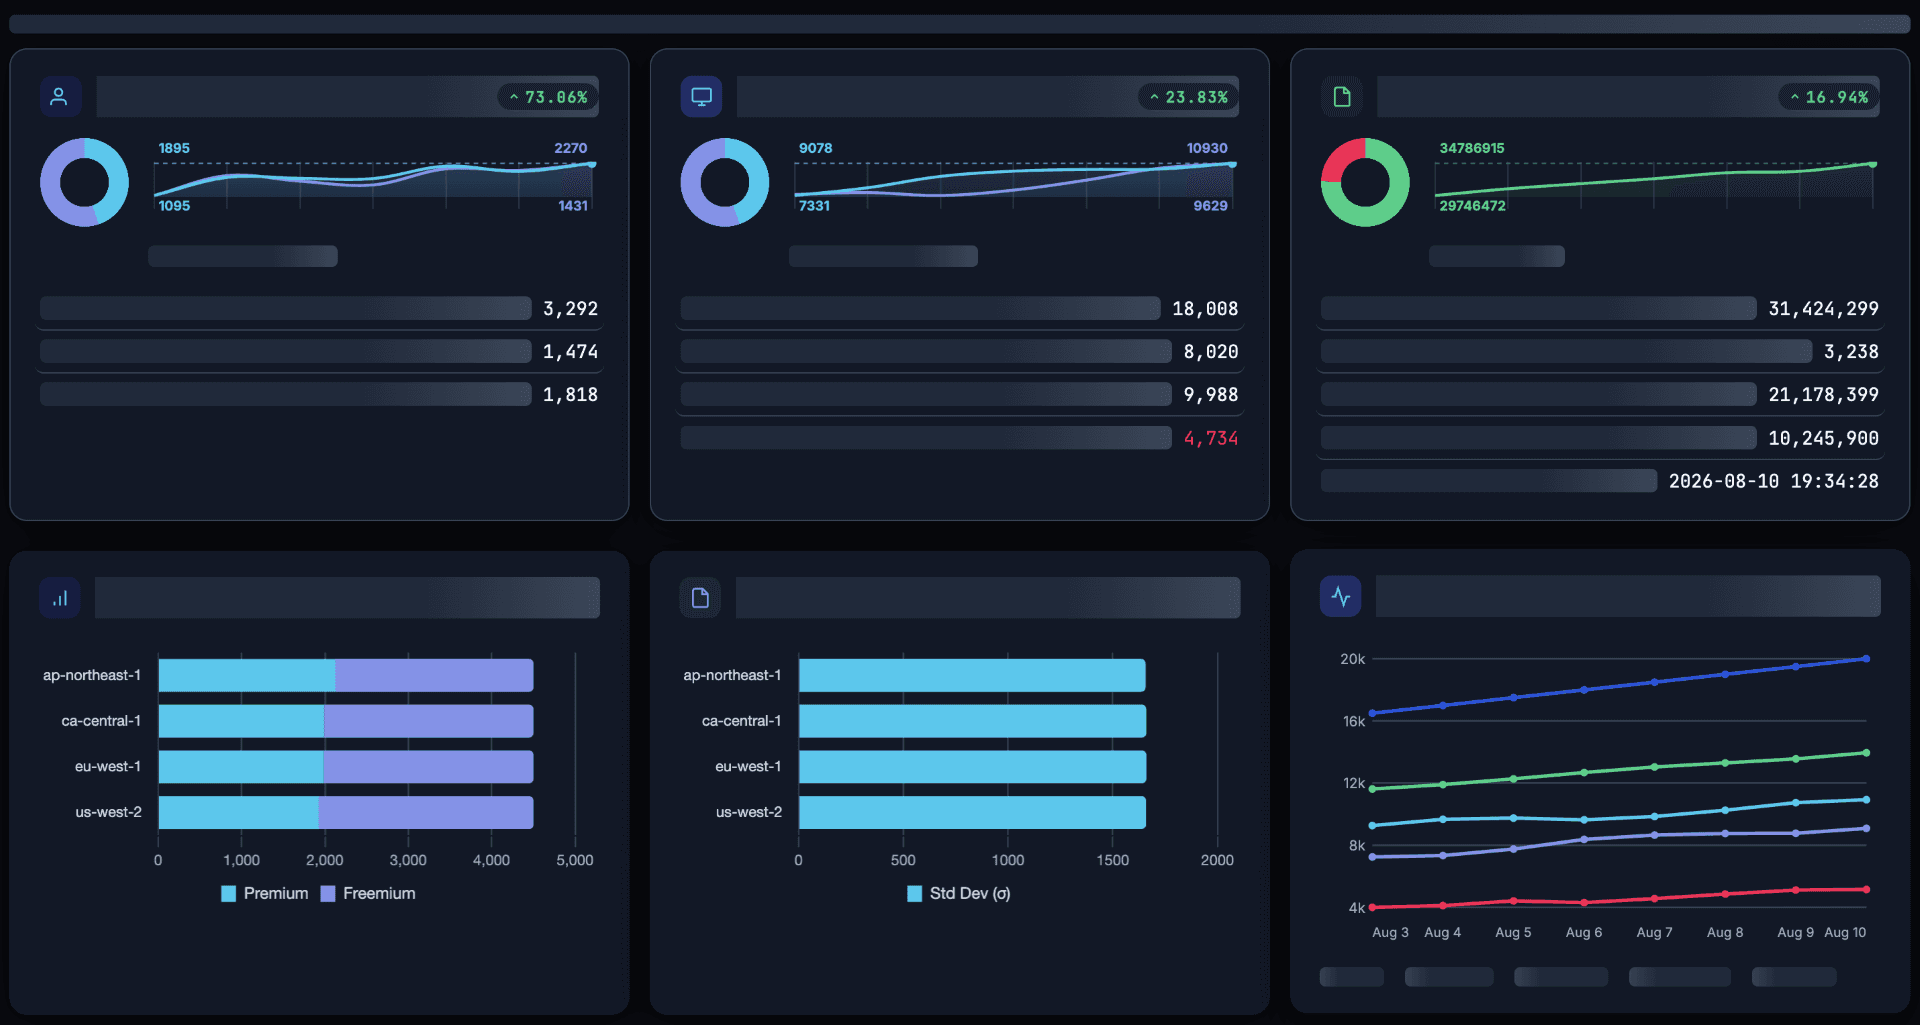
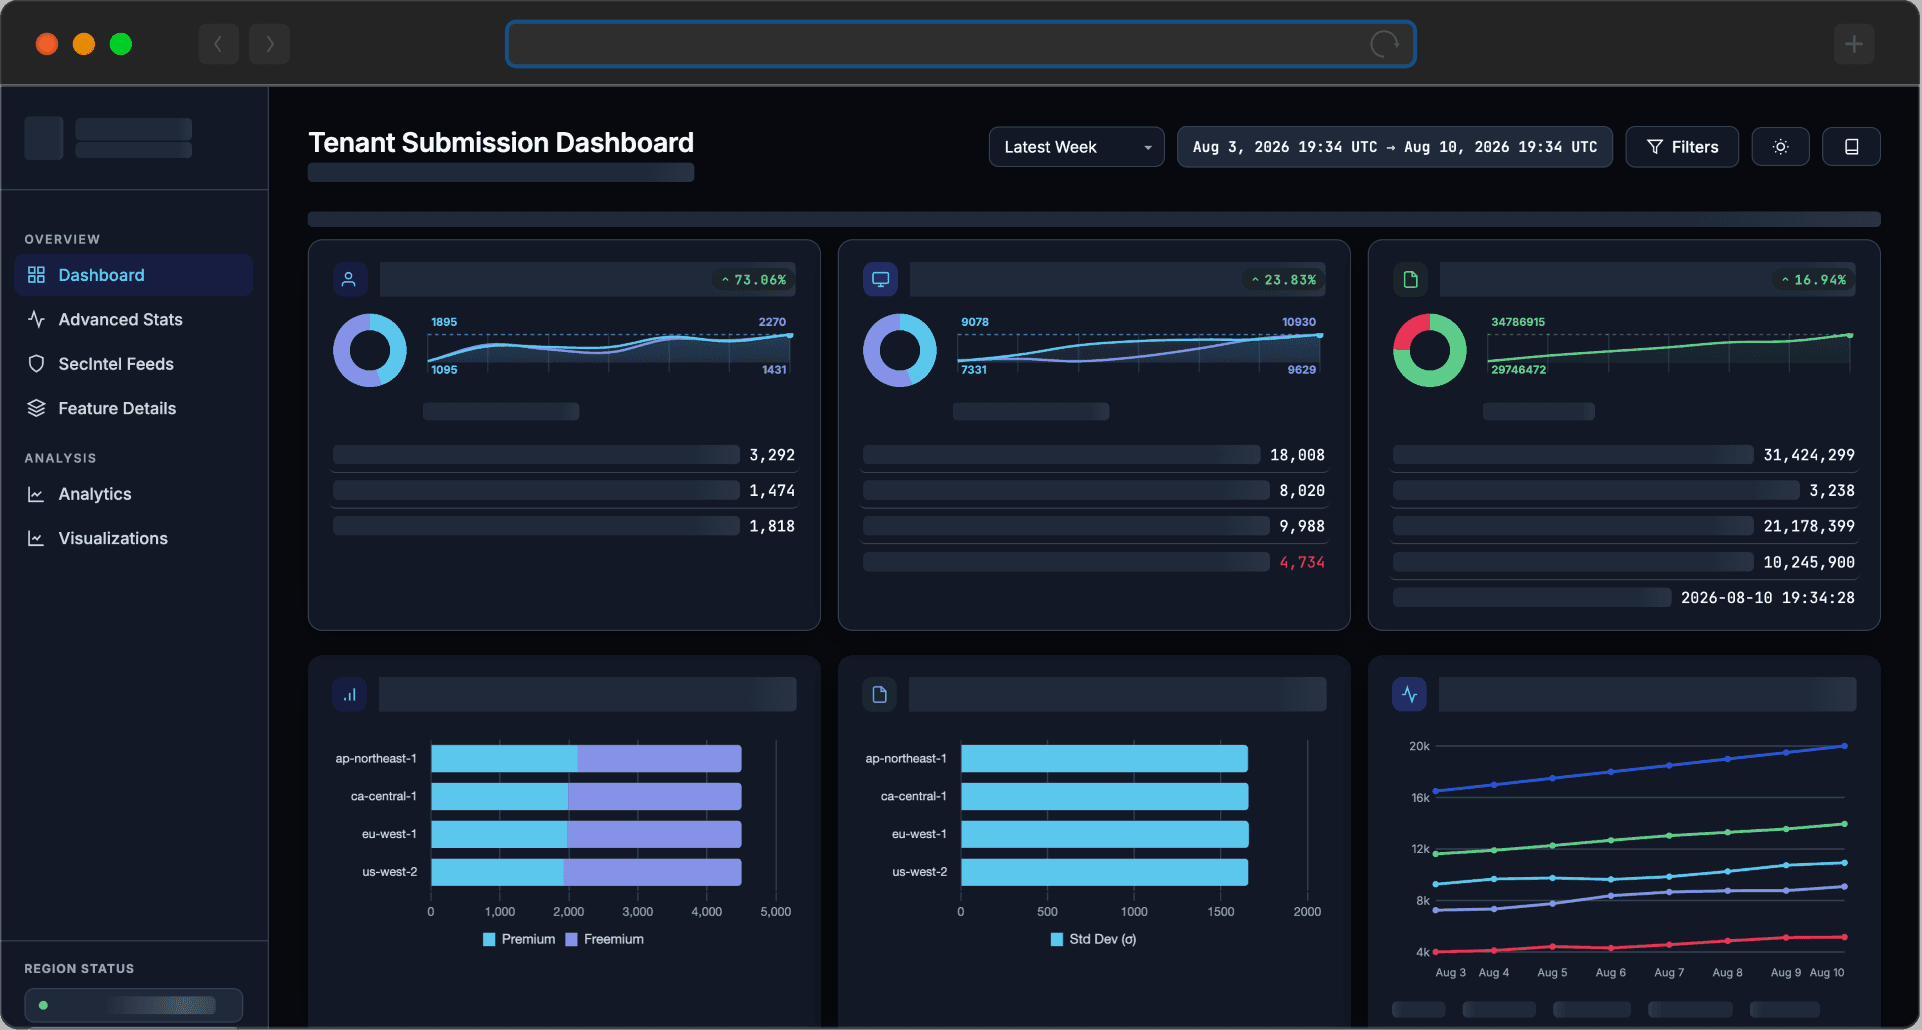
Over on the backend, I employed Python for advanced data analytics, newly constructed APIs, and automated data collection running on EC2 instances. To solve the performance bottlenecks of the legacy site, I restructured how data was queried and held in memory, replacing repeated full-table pulls with paginated requests and a caching layer for frequently accessed results. Notably, I built 35 new metrics (up from 10), drill-down interactivity, dynamic filtering, configurable data collection periods, automated email reports, and export functionality.

results.
The rebuild cut load times by 97.5%, bringing what was once a 15-second wait down to near-instant, and more than tripled the metrics available to leadership, from around 10 to 56. Execs went from having almost no visibility into customer behavior to being able to drill into individual customers and their devices across over 20,000 concurrently tracked devices. What was once a dashboard execs struggled to use now drives weekly business decisions across 2,000+ tenants, with automated reports delivering the most relevant data straight to subscribed leadership every week. The project turned a tool that leadership largely avoided into one they now actively rely on.